Nagios is an awesome Open Source monitoring tool, its provides you more comprehensive monitoring environment to always keep an eye on your all machines / networks whether you are in a your data center or just your small labs.
With Nagios, you can monitor your remote hosts and their services remotely on a single window. It shows warnings and indicates if something goes wrong in your servers which eventually helps us to detect some problems before they occur. It helps us to reduce downtime and business losses.
Recently, Nagios released its latest versions Nagios 4.0.1 on 15th October 2013, and its latest stable release of Nagios plugins 1.5.
This article is intended to guide you with easy instructions on how to install latest Nagios 4.0.1 from source (tarball) on RHEL 6.4/6.3/6.2/6.1/6/5.8, CentOS 6.4/6.3/6.2/6.1/6/5.8 and Fedora 19,18,17,16,15,14,13,12 distributions. Within 30 minutes you will be monitoring your local machine, no any advanced installation procedure only basic installation that will work 100% on most of the today’s Linux servers.
Please Note: The installation instructions were shown in here are written based on CentOS 6.4 Linux distribution.

Congratulations! You’ve successfully installed and configured Nagios and its Plugins. You’ve just begin your journey into monitoring.
With Nagios, you can monitor your remote hosts and their services remotely on a single window. It shows warnings and indicates if something goes wrong in your servers which eventually helps us to detect some problems before they occur. It helps us to reduce downtime and business losses.
Recently, Nagios released its latest versions Nagios 4.0.1 on 15th October 2013, and its latest stable release of Nagios plugins 1.5.
This article is intended to guide you with easy instructions on how to install latest Nagios 4.0.1 from source (tarball) on RHEL 6.4/6.3/6.2/6.1/6/5.8, CentOS 6.4/6.3/6.2/6.1/6/5.8 and Fedora 19,18,17,16,15,14,13,12 distributions. Within 30 minutes you will be monitoring your local machine, no any advanced installation procedure only basic installation that will work 100% on most of the today’s Linux servers.
Please Note: The installation instructions were shown in here are written based on CentOS 6.4 Linux distribution.
Installing Nagios 4.0.1 and Nagios Plugin 1.5
If you follow these instructions correctly, you will end up with following information.- Nagios and its plugins will be installed under /usr/local/nagios directory.
- Nagios will be configured to monitor few services of your local machine (Disk Usage, CPU Load, Current Users, Total Processes, etc.)
- Nagios web interface will be available at http://localhost/nagios
Step 1: Install Required Dependencies
We need to install Apache, PHP and some libraries like gcc, glibc, glibc-common and GD libraries and its development libraries before installing Nagios 4.0.1 with source. And to do so we can use yum default package installer.[root@tecmint]# yum install -y httpd php gcc glibc glibc-common gd gd-devel make net-snmp (RedHat / CentOS)
Step 2: Create Nagios User and Group
Create a new nagios user and nagcmd group account and set a password.[root@tecmint]# useradd nagios [root@tecmint]# groupadd nagcmdNext, add both the nagios user and the apache user to the nagcmd group.
[root@tecmint]# usermod -G nagcmd nagios
[root@tecmint]# usermod -G nagcmd apache
Step 3: Download Nagios Core 4.0.1 and Nagios Plugin 1.5
Create a directory for your Nagios installation and all its future downloads.[root@tecmint]# mkdir /root/nagios [root@tecmint]# cd /root/nagiosNow download latest Nagios Core 4.0.1 and Nagios plugins 1.5 packages with wget command.
[root@tecmint nagios~]# wget http://prdownloads.sourceforge.net/sourceforge/nagios/nagios-4.0.1.tar.gz
[root@tecmint nagios~]# wget https://www.nagios-plugins.org/download/nagios-plugins-1.5.tar.gz
Step 4: Extract Nagios Core and its Plugins
We need to extract downloaded package with tar command as follows.[root@tecmint nagios~]# tar –xvf nagios-4.0.1.tar.gz [root@tecmint nagios~]# tar –xvf nagios-plugins-1.5.tar.gzWhen you extract these tarballs with tar command, two new folders will appear in that directory.
[root@tecmint nagios ~]# ll
total 3712
drwxrwxr-x 18 root root    4096 Oct 17 03:28 nagios-4.0.1
-rw-r--r--  1 root root 1695367 Oct 15 19:49 nagios-4.0.1.tar.gz
drwxr-xr-x 15  200  300    4096 Oct 14 10:18 nagios-plugins-1.5
-rw-r--r--  1 root root 2428258 Oct  2 11:27 nagios-plugins-1.5.tar.gz
Configure Nagios Core
Now, first we will configure Nagios Core and to do so we need to go to Nagios directory and run configure file and if everything goes fine, it will show the output in the end as sample output. Please see below.[root@tecmint nagios~]# cd nagios-4.0.1 [root@tecmint nagios-4.0.1 ]# ./configure --with-command-group=nagcmd
Sample output:
Nagios executable:  nagios
        Nagios user/group:  nagios,nagios
       Command user/group:  nagios,nagcmd
             Event Broker:  yes
        Install ${prefix}:  /usr/local/nagios
    Install ${includedir}:  /usr/local/nagios/include/nagios
                Lock file:  ${prefix}/var/nagios.lock
   Check result directory:  ${prefix}/var/spool/checkresults
           Init directory:  /etc/rc.d/init.d
  Apache conf.d directory:  /etc/httpd/conf.d
             Mail program:  /bin/mail
                  Host OS:  linux-gnu

 Web Interface Options:
 ------------------------
                 HTML URL:  http://localhost/nagios/
                  CGI URL:  http://localhost/nagios/cgi-bin/
 Traceroute (used by WAP):  /bin/traceroute

Review the options above for accuracy.  If they look okay,
type 'make all' to compile the main program and CGIs.
Now, after configuring we need to Compile and install all the binaries with make command and make install command will install all the needed libraries in your machine and we can proceed further.[root@tecmint nagios-4.0.1 ]# make all [root@tecmint nagios-4.0.1 ]# make install
Sample output:
*** Main program, CGIs and HTML files installed ***

You can continue with installing Nagios as follows (type 'make'
without any arguments for a list of all possible options):

  make install-init
     - This installs the init script in /etc/rc.d/init.d

  make install-commandmode
     - This installs and configures permissions on the
       directory for holding the external command file

  make install-config
     - This installs sample config files in /usr/local/nagios/etc
Following command will install the init scripts for Nagios.[root@tecmint nagios-4.0.1 ]# make install-initTo make nagios work from command line we need to install command-mode.
[root@tecmint nagios-4.0.1 ]# make install-commandmodeNext, install sample nagios files, please run following command.
[root@tecmint nagios-4.0.1 ]# make install-config
Sample output:
/usr/bin/install -c -m 775 -o nagios -g nagios -d /usr/local/nagios/etc
/usr/bin/install -c -m 775 -o nagios -g nagios -d /usr/local/nagios/etc/objects
/usr/bin/install -c -b -m 664 -o nagios -g nagios sample-config/nagios.cfg /usr/local/nagios/etc/nagios.cfg
/usr/bin/install -c -b -m 664 -o nagios -g nagios sample-config/cgi.cfg /usr/local/nagios/etc/cgi.cfg
/usr/bin/install -c -b -m 660 -o nagios -g nagios sample-config/resource.cfg /usr/local/nagios/etc/resource.cfg
/usr/bin/install -c -b -m 664 -o nagios -g nagios sample-config/template-object/templates.cfg /usr/local/nagios/etc/objects/templates.cfg
/usr/bin/install -c -b -m 664 -o nagios -g nagios sample-config/template-object/commands.cfg /usr/local/nagios/etc/objects/commands.cfg
/usr/bin/install -c -b -m 664 -o nagios -g nagios sample-config/template-object/contacts.cfg /usr/local/nagios/etc/objects/contacts.cfg
/usr/bin/install -c -b -m 664 -o nagios -g nagios sample-config/template-object/timeperiods.cfg /usr/local/nagios/etc/objects/timeperiods.cfg
/usr/bin/install -c -b -m 664 -o nagios -g nagios sample-config/template-object/localhost.cfg /usr/local/nagios/etc/objects/localhost.cfg
/usr/bin/install -c -b -m 664 -o nagios -g nagios sample-config/template-object/windows.cfg /usr/local/nagios/etc/objects/windows.cfg
/usr/bin/install -c -b -m 664 -o nagios -g nagios sample-config/template-object/printer.cfg /usr/local/nagios/etc/objects/printer.cfg
/usr/bin/install -c -b -m 664 -o nagios -g nagios sample-config/template-object/switch.cfg /usr/local/nagios/etc/objects/switch.cfg

*** Config files installed ***

Remember, these are *SAMPLE* config files.  You'll need to read
the documentation for more information on how to actually define
services, hosts, etc. to fit your particular needs.
Step 5: Customizing Nagios Configuration
Open the “contacts.cfg” file with your choice of editor and set the email address associated with the nagiosadmin contact definition to receiving email alerts.# vi /usr/local/nagios/etc/objects/contacts.cfg
Sample Output
###############################################################################
###############################################################################
#
# CONTACTS
#
###############################################################################
###############################################################################

# Just one contact defined by default - the Nagios admin (that's you)
# This contact definition inherits a lot of default values from the 'generic-contact'
# template which is defined elsewhere.

define contact{
       contact_name                    nagiosadmin             ; Short name of user
       use                             generic-contact         ; Inherit default values from generic-contact template (defined above)
       alias                           Nagios Admin            ; Full name of user

       email                           tecmint@tecmint.com     ; *** CHANGE THIS TO YOUR EMAIL ADDRESS ****
       }
Step 6: Install and Configure Web Interface for Nagios
We are done with all configuration in the backend, now we will configure Web Interface For Nagios with following command. The below command will Configure Web interface for Nagios and a web admin user will be created “nagiosadmin”.[root@tecmint nagios-4.0.1 ]# make install-webconfIn this step, we will be creating a password for “nagiosadmin”. After executing this command, please provide a password twice and keep it remember because this password will be used when you login in the Nagios Web interface.
[root@tecmint nagios-4.0.1]# htpasswd -s -c /usr/local/nagios/etc/htpasswd.users nagiosadmin
New password:
Re-type new password:
Adding password for user nagiosadmin
Restart Apache to make the new settings take effect.
[root@tecmint ]# service httpd start (On RedHat / CentOS)
[root@tecmint ]# systemctl start httpd.service (On Fedora)
Step 7: Compile and Install Nagios Plugin
We have downloaded nagios plugins in /root/nagios, Go there and configure and install it as directed below.[root@tecmint nagios]# cd /root/nagios [root@tecmint nagios]# cd nagios-plugins-1.5 [root@tecmint nagios]# ./configure --with-nagios-user=nagios --with-nagios-group=nagios [root@tecmint nagios]# make [root@tecmint nagios]# make install
Step 8: Verify Nagios Configuration Files
Now we are all done with Nagios configuration and its time to verify it and to do so please insert following command. If everything goes smooth it will show up similar to below output.[root@tecmint nagios]# /usr/local/nagios/bin/nagios -v /usr/local/nagios/etc/nagios.cfg
Sample Output
/usr/bin/install -c -m 644 sample-config/httpd.conf /etc/httpd/conf.d/nagios.conf

*** Nagios/Apache conf file installed ***

 /usr/local/nagios/bin/nagios -v /usr/local/nagios/etc/nagios.cfg
...
...
Total Warnings: 0
Total Errors:   0
Step 9: Add Nagios Services to System Startup
To make Nagios work across reboots, we need to add nagios and httpd with chkconfig command.[root@tecmint ]# chkconfig --add nagios [root@tecmint ]# chkconfig --level 35 nagios on [root@tecmint ]# chkconfig --add httpd [root@tecmint ]# chkconfig --level 35 httpd onRestart Nagios to make the new settings take effect.
[root@tecmint ]# service nagios start (On RedHat / CentOS)
[root@tecmint ]# systemctl start nagios.service (On Fedora)
Step 10: Login to the Nagios Web Interface
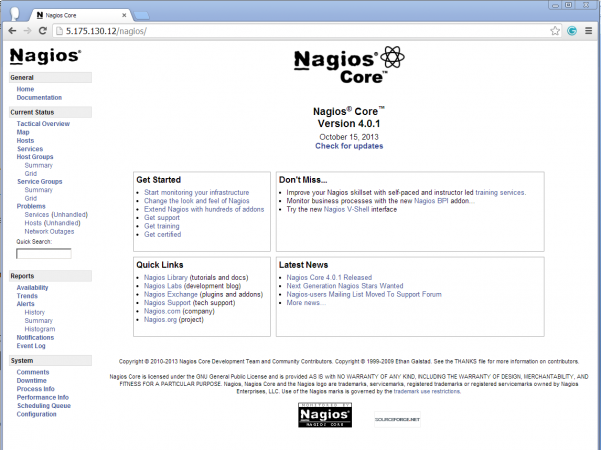
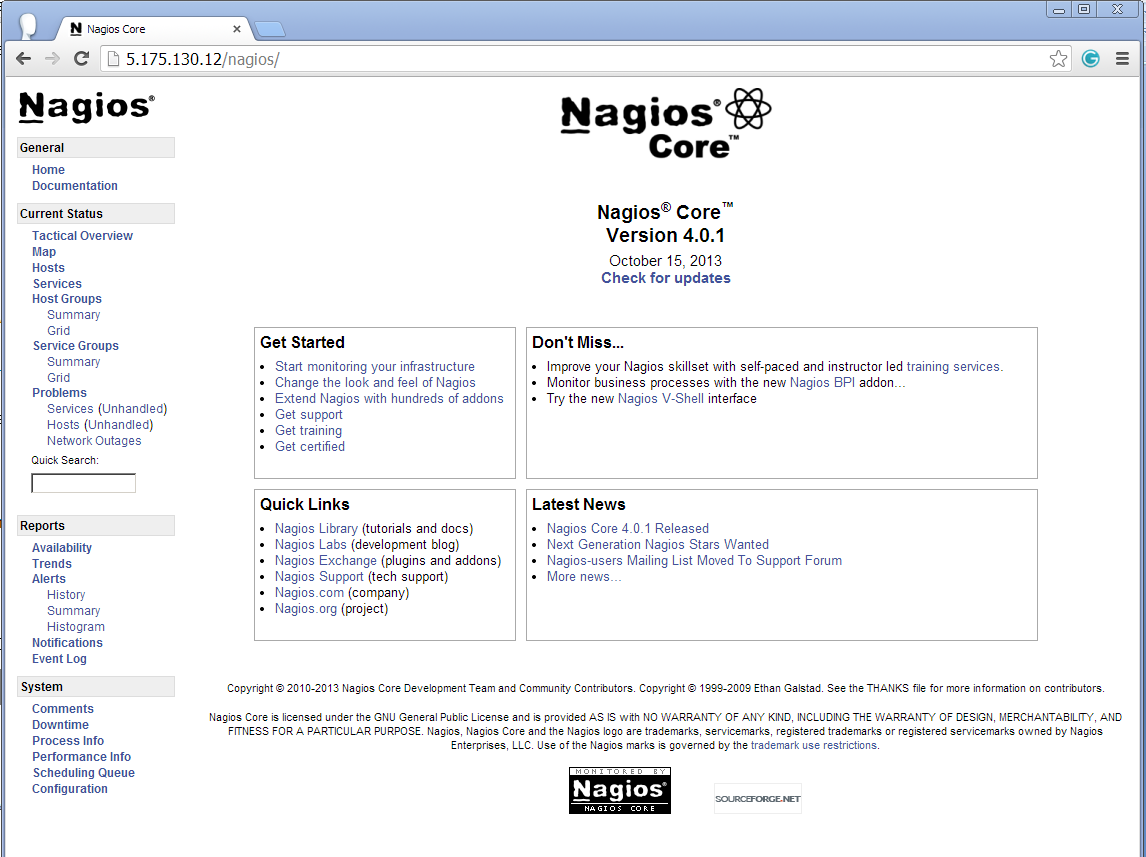
Your nagios is ready to work, please open it in your browser with “http://Your-server-IP-address/nagios” or “http://FQDN/nagios” and Provide the username “nagiosadmin” and password.Nagios Login
Nagios Web Interface
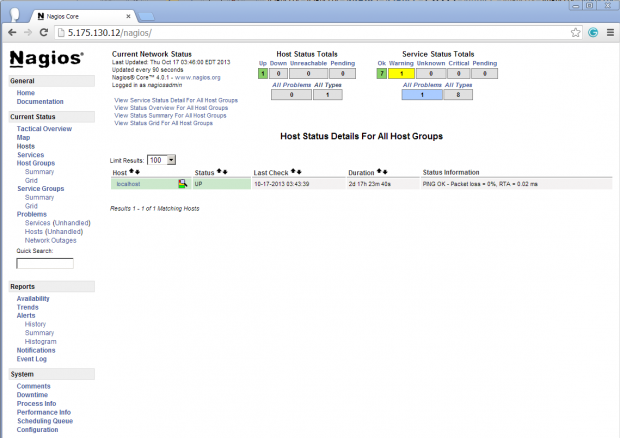
Host View

Nagios Host View
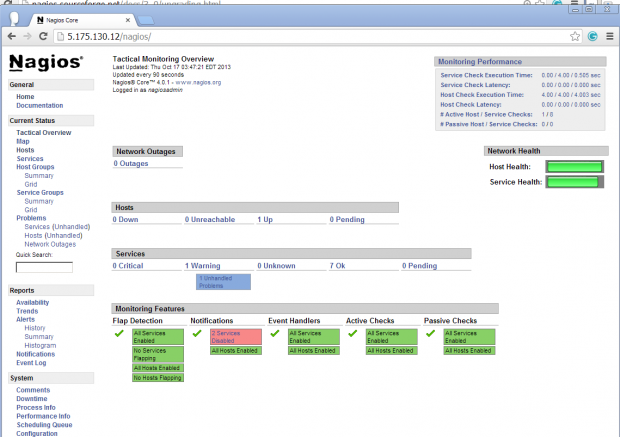
Nagios Overview

Nagios Overview
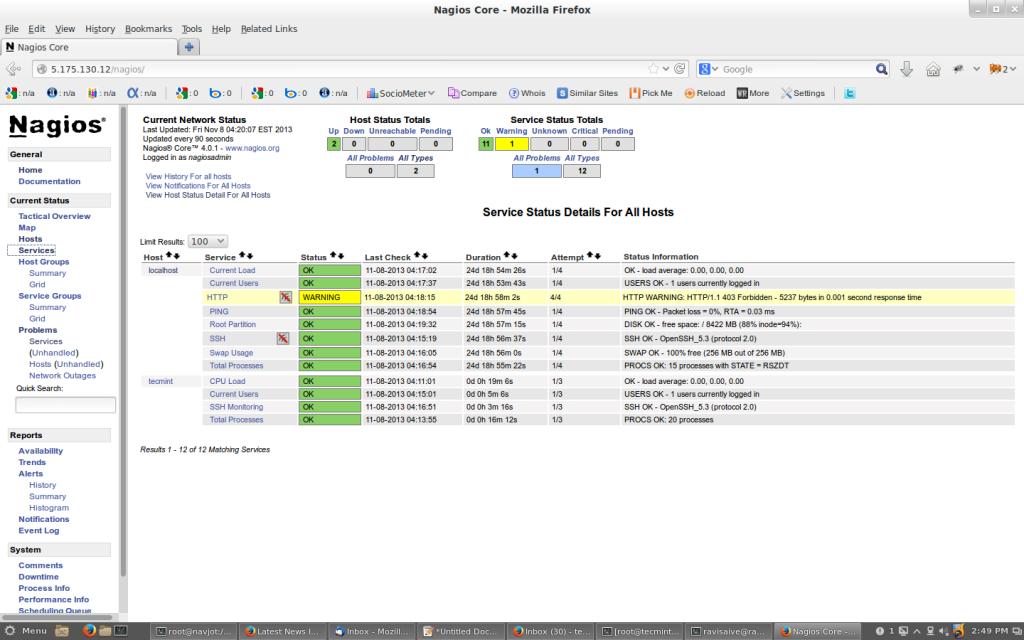
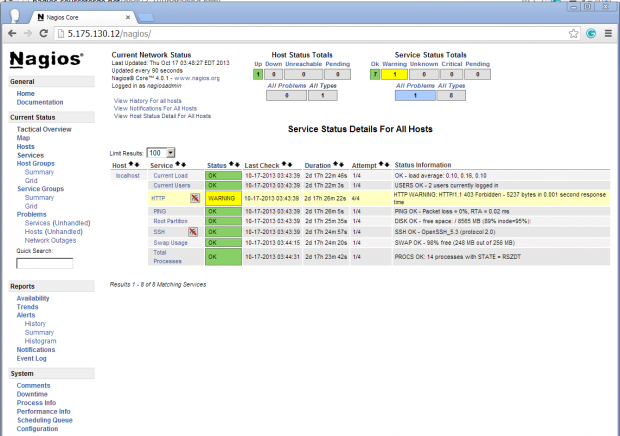
Service View
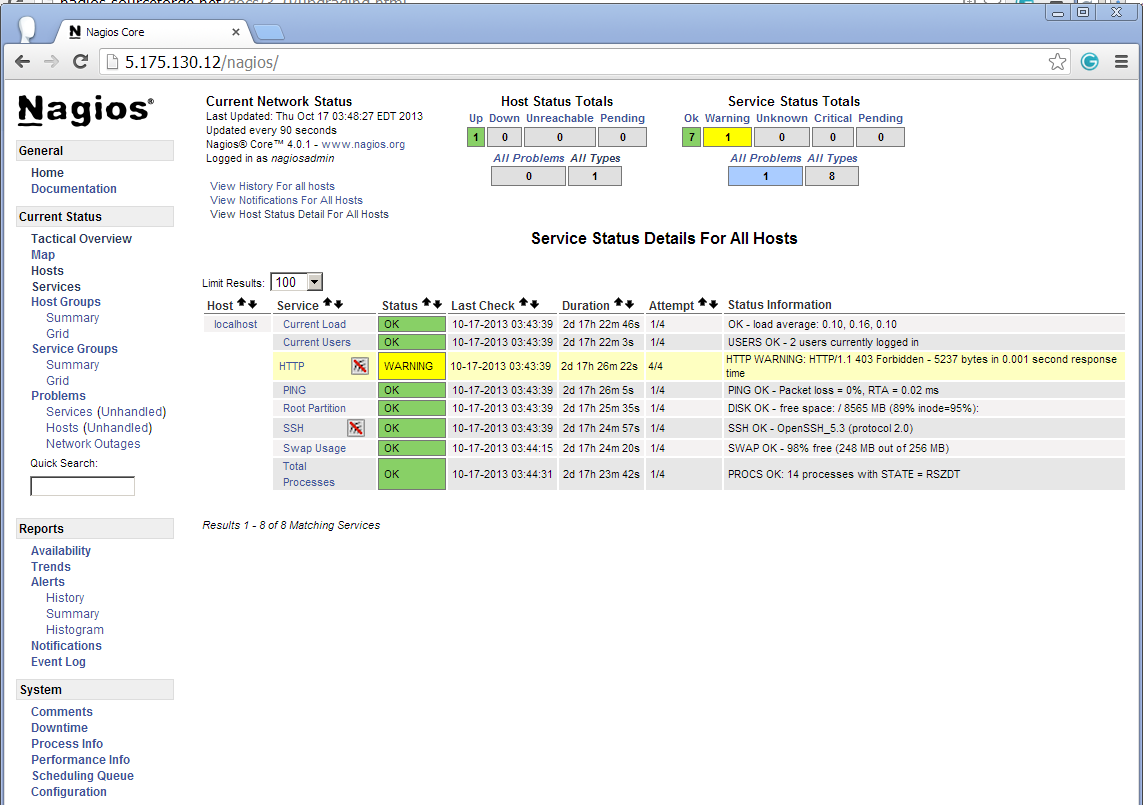
Nagios View Services
Process View
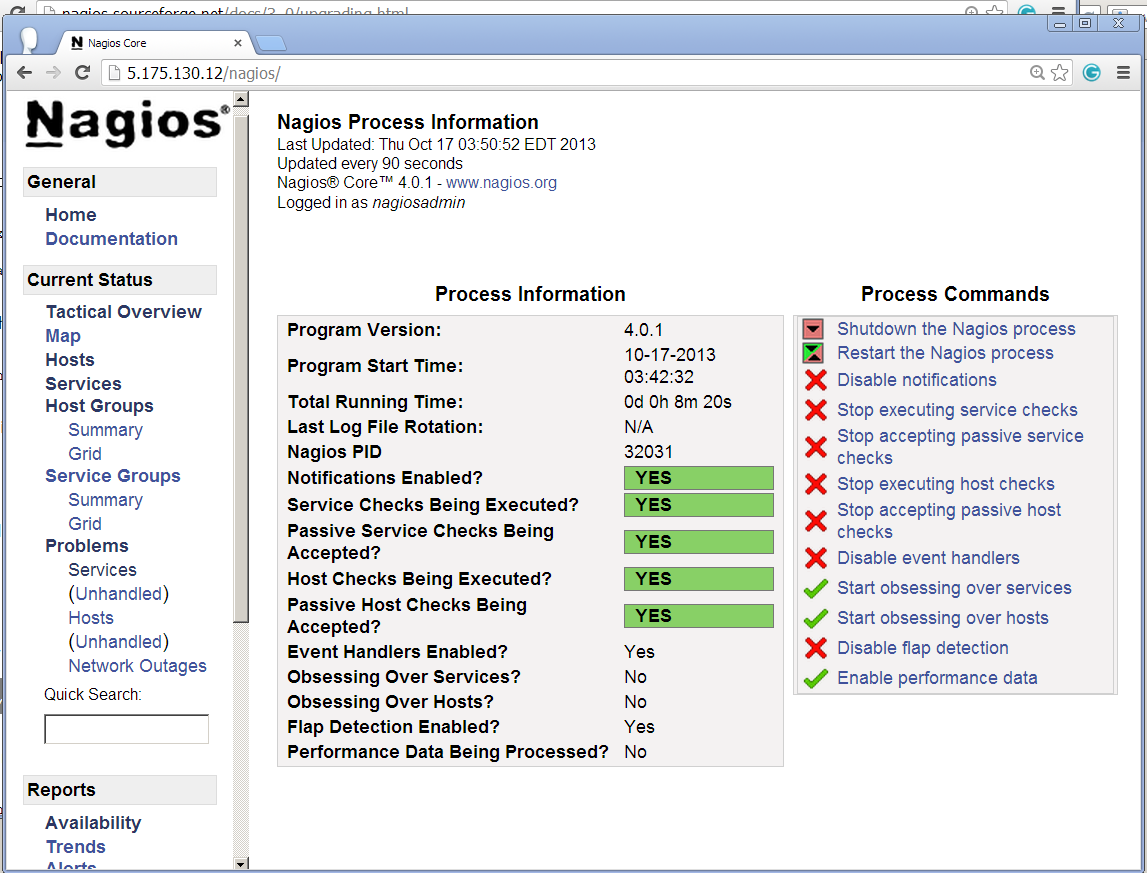
Process View
Upgrade Nagios 3.x to Nagios 4.0.1
If you are already running an older version of Nagios, you can upgrade it anytime. To do so, you just need to download the latest tar archive of it and configure it as shown below.[root@tecmint ]# service nagios stop [root@tecmint ]# tar –zxvf nagios-4.0.1.tar.gz [root@tecmint ]# cd nagios-4.0.1 [root@tecmint ]# ./configure [root@tecmint ]# make all [root@tecmint ]# make install [root@tecmint ]# service nagios startThat’s it for now, in my upcoming articles, I will show you how to add Linux, Windows, Printers, Switches and Devices to Nagios monitoring Server. If you’re having any trouble while installing, please do contact us via comments.